



 Previous
 Next
NextFinancial capital

PURPOSE
The purpose of this review is to provide insight into the financial performance and financial position of the group for the year ended 31 December 2018 and should be read in conjunction with the annual financial statements presented here.
OVERVIEW
Consistent and improving operational performance driving underlying financial delivery
Strong operational performance drove an increase in sales volumes on the prior year of 5%, achieving record sales volume of 245 000 tons (2017: 233 000 tons). This was complemented by strong unit conversion margins which were 4% better than the prior year.
Continued delivery of Hulamin’s cost management programme and an increase in the utilisation of market scrap in Hulamin’s input metal mix assisted to offset the impact of inflationary pressures, including the significant impact of higher commodity prices, most notably Brent crude, relative to the comparative period. Manufacturing costs on a per unit basis were 3.5% higher than the prior year, but lower by 1.2% in real terms.
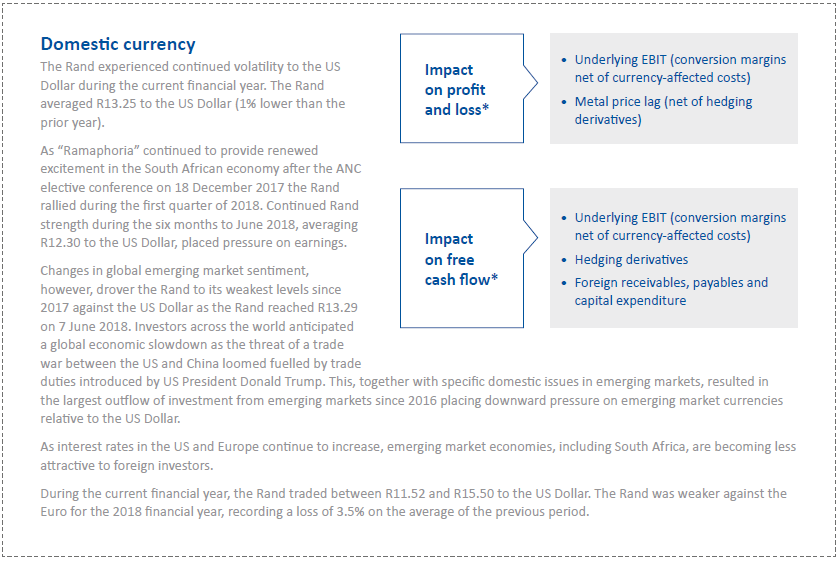
The Rand was less of a factor on a year on year basis, although it was volatile, averaging R12.30 in the first half and R14.18 in the second.
Earnings per share decreased to negative 242 cents in 2018 following the recognition of a R1,45 billion impairment charge. Normalised earnings per share¹ improved by 20% over the prior year.
The non-repeat of a significant metal price lag gain of R150 million in the comparative period compared with a gain of just R4 million in the current year, offset by once-off adjustments, including an accounting anomaly (which also resulted in a restatement of prior year results), resulted in a 4% decline in Hulamin’s headline earnings per share to 91 cps from the 95 cps achieved in the previous year (as restated).
Group earnings before interest, tax, depreciation and amortisation (EBITDA), on a headline basis, improved 4% to R742 million (31% increase before metal price lag).
The second half of 2018 recorded an impairment loss of R1,45 billion bringing EPS down to negative 255 cents in the second half. Underlying results in the second half of 2018 were particularly strong, recording HEPS of 78 cps, after HEPS of 13 cps was achieved in the first half. After adjusting for once-off items and the impact of metal price lag, normalised¹ EPS of 58 cps was achieved in the second half of 2018, demonstrating the sensitivity of Hulamin’s results to the currency.
Consistent strong free cash flow delivery
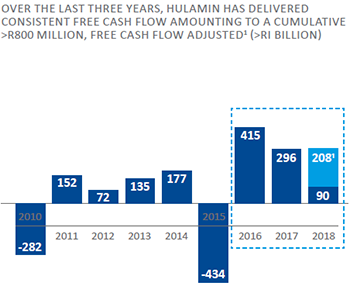
Continued focus on working capital efficiencies, together with responsible levels of capital expenditure resulted in cash inflows before financing activities (free cash flow) of R90 million which enabled the group to reduce its borrowings to R294 million from R317 million at the close of the comparative period. Free cash flow (adjusted), represented by free cash flow adjusted for the inclusion of a significant customer payment, of R298 million (2017: R296 million) was achieved. Further information is provided in the Supplementary information section of this report.
Consistent and increasing returns to shareholders
A final dividend of 18 cps was declared for the 2018 financial year (a dividend cover ratio of 5 times HEPS). A dividend of 15 cps was declared in 2017 (7 times HEPS).
In addition, Hulamin will distribute capital to shareholders by means of a general share buy-back. Hulamin has set aside R60 million for this share buy-back which is intended to run for approximately the next 12 months.
Given the current discount of Hulamin’s market capitalisation to net asset value, the strong trend in underlying financial performance and generation of cash flow, and following the conclusion of a substantial strategic review, Hulamin will repurchase shares on an open market repurchase programme until the annual general meeting in terms of the existing shareholder approval obtained at the previous annual general meeting, and will continue with this programme subject to further shareholder approval at the 2019 AGM.
MARKET REVIEW
Key external drivers of performance




FINANCIAL PERFORMANCE
The financial performance of the group is measured in terms of various key financial measures which include operating profit, headline and normalised earnings, return on capital employed, cash flow generation, gearing and liquidity, as set out below in further detail.
SEGMENT PERFORMANCE
The Rolled Products segment recorded operating profits of R530 million (before impairment), an increase of 10% over the prior year. Hulamin Extrusions incurred an operating loss (before impairment) of R29 million during the current period as stagnant local market demand and continued imports from Chinese markets eroded volumes and margins. Note 2.1 of the group financial statements discloses more information on our operating segments contribution.
Hulamin Rolled Products 2017 results have been restated and this has also impacted on the 2018 results (refer section entitled ACCOUNTING POLICIES below). The impact of this has been an increase in 2018 operating profit of R40 million and a decrease in 2017 of the equivalent amount.
Rolled Products operating profit
Controllable earnings
The Rolled Products segment built on strong manufacturing performance delivered in 2017, which included a 12-day integrated shut. Risk mitigation systems continue to be effective and the plant reliability was stable. This led to an improvement in sales volumes to a record 229 000 tons (group sales volumes improved to a record 245 000 tons).
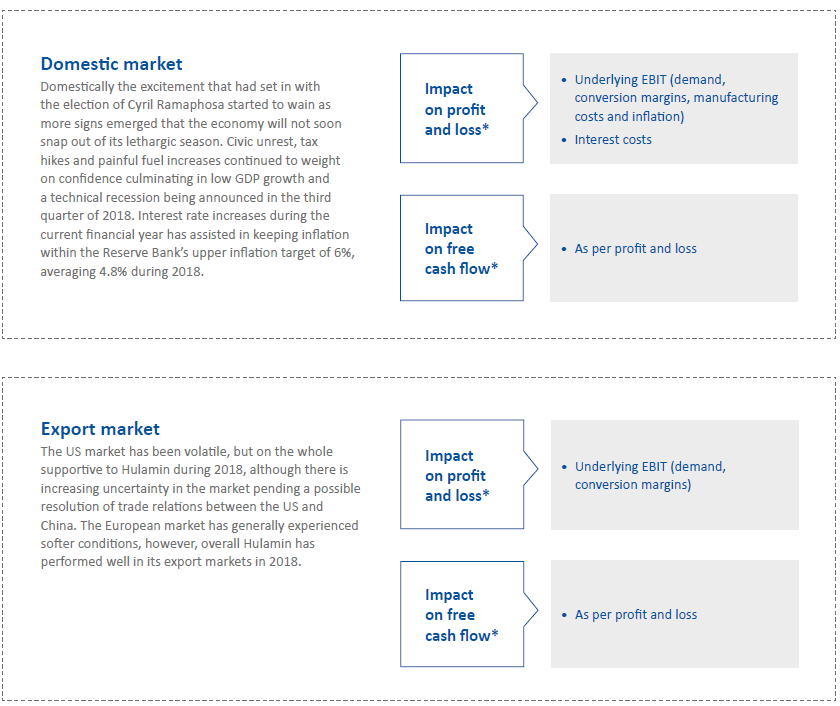
Overall, average unit US Dollar rolling margins achieved in 2018 were some 4% higher than the prior year. Trading conditions in the local market faced some pressure as Chinese supply flooded the South African market with the imposition of US trade duties particularly against Chinese metal. In the local market can stock sales represent 46% of total domestic sales, up from 40% in the prior period. A strong performance in export market margins was achieved in 2018 as Hulamin benefited from favourable market conditions in the US.
Material costs, packaging and gas costs were impacted by higher commodity and crude oil prices and increased volumes. Salary and wage increases in 2018 were above the official consumer price inflation level, however, there was a welcome reduction in the rate of increase in electricity prices approved by NERSA for the period 1 July 2017 to June 2018 to 2.2%. However, due to the poor financial state of Eskom, the risk remains that electricity prices will increase significantly going forward.
Excellent progress was made during the current financial year both in terms of the delivery of continued cost reduction against target and the development and the roll out of Hulamin’s cost optimisation programme. This, together with the strong production performance, mitigated the impact of inflation and commodity price increases, and resulted in an improvement in unit manufacturing costs at Rolled Products in real terms by 1.2% (3.5% higher in nominal terms).
Hulamin’s cost optimisation programme, which was rolled out at the beginning of 2017, aims to deliver further measurable, sustainable cost reduction of R300 million over the next five years.
In the current year, Hulamin delivered a number of cost reductions through the deployment of lean methodology, supported by improved cost management systems. Procurement and supply chain improvements resulted in reductions in certain material and packaging costs. Baseline gas costs improved as Rolled Products converted a further 35% of its gas supply to compressed natural gas, which now stands at 45% of its total supply. The remelt and casting operation remains fully supplied by liquid petroleum gas, whilst Hulamin continues to seek a long-term solution to securing piped gas into the region.
Currency impact on underlying operating profit (externality)
The Rand averaged R13.25/USD for the 2018 financial year, 1% stronger than the previous year’s average of R13.32/USD. This had a slightly negative impact on the current year’s operating profit as Hulamin’s conversion margins are predominantly foreign currency-denominated.
Metal price lag (externality)
Following a significant metal price lag gain of R150 million in 2017, a gain of just R4 million was realised in the current year as the Rand aluminium price during the last few months of 2018 was only slightly higher than the corresponding period in 2017, while inventory levels were similar.
FINANCE COSTS
Net interest paid decreased by 19% to R80 million as a result of lower average borrowings during the current financial year.
Net finance cost was only slightly lower than the comparative period at R74 million due to a lower proportion of borrowing costs capitalised to plant and equipment in the current financial year.
TAXATION
The effective rate decreased from 27.8% to 24.4% in the current year, largely due to a deferred tax asset in relation to the Hulamin Extrusions operating segment not being recognised.
HEADLINE EARNINGS
Basic headline earnings for the group decreased by 4% to R292 million in 2018 from R305 million in the previous year.
FREE CASH FLOW
A strong operational performance and working capital management, together with controlled capital expenditure, resulted in the group generating cash flow before financing activities (free cash flow) of R90 million (2017: R296 million), and free cash flow (adjusted) of R298 million. (2017: R296 million).
Operating cash flow
The group generated positive cash flow before working capital changes of R673 million in 2018, a 10% decrease on the previous year.
Working capital management
Working capital increased by R284 million (8%) in the 2018 financial year, largely attributable a 5% increase in sales volumes and the increase in rolling margins.
Rolled Products has continued to improve its inventory efficiencies, building on improvements delivered since 2016. The Rand value of inventory nevertheless increased by 5% but declined in terms of number of days of sales.
Rand receivables increased by 25% over 2017. The increase in receivables was mainly due to higher levels of sales, together with increased conversion margins. Overall, improved efficiencies were recognised. Almost all receivables are insured, with a 10% deductible, and the quality of the book remains excellent.
Trade payables increased by 11% on the prior year, mainly as result of the impact of the higher volume levels.
Capital expenditure and commitments
Cash outflows from investing activities for the year decreased to R242 million from the R261 million net outflow in 2017. An amount of R175 million (2017: R43 million) has been contracted and committed but not spent.
CAPITAL MANAGEMENT
BORROWINGS AND LIQUIDITY
Net borrowings closed at R294 million, down from the R317 million on the prior year closing position. Borrowings comprised the balance of R108 million on an original R270 million term loan (put in place to fund the investment in Hulamin’s recycling facility), a R632 million revolving working capital loan and a R80 million loan from the employer surplus in the pension fund, reduced by cash balances of R526 million. Committed facilities totalled R1 838 million, leaving headroom of R1 544 million at year-end.
Key covenants on the debt package are a current ratio in excess of 1.25 times and a debt-to-equity ratio less than 0.5 times. All covenants have been met with a significant safety margin in the 2018 financial year.
Gearing (net debt to equity) increased to 8%, after the impairment charge. The low level of gearing is expected to be further reduced in the short term.
Dividends
The group has maintained its policy to target a distribution to shareholders which is three times covered by headline earnings, after due consideration of current and forecast cash-generation, liquidity and gearing levels, and planned capital expenditure.
A final dividend for the 2018 financial year of 18 cps has been approved (2017: 15 cps). This represents a distribution which is five times covered by headline earnings and is considered appropriate in order to permit a further reduction in the group’s gearing levels.
In addition, the group has reserved R60 million to fund an open market share repurchase programme over the next 12 months.
KEY FINANCIAL RISKS AND RELATED HEDgING ACTIVITIES
METAL PRICE RISK AND CURRENCY EXPOSURE
Hulamin purchases primary aluminium and converts this into rolled or extruded aluminium products. It sells the aluminium component in its products to its customers and, in addition, earns a conversion margin as compensation for its costs of casting, rolling, extruding and finishing its various products.
Conversion margin and costs (currency risk)
The group’s conversion margins, particularly in its Rolled Products segment, are largely denominated in US Dollar and Euro. Certain of its manufacturing and distribution costs are also foreign currency-denominated.
The group does not hedge these exposures and its profits are therefore impacted by currency levels on its conversion margins net of foreign-denominated costs.
Aluminium purchases and sales (metal price and currency risk)
The price of aluminium purchased by the group and sold to its customers is typically based on the monthly average US Dollar LME price in the month prior to the month of delivery. It usually takes about three months to produce and invoice the semi-fabricated products sold to customers and during this period the quoted LME price may increase or decrease. Similarly, the Rand fluctuates against the US Dollar during this period, resulting in the purchase price of aluminium in Rand differing from the price realised upon sale.
On an unhedged basis, this can result in a high level of profit and loss volatility as metal pricing in cost of sales, based on an inventory FIFO valuation, is misaligned with metal pricing in sales. However, there is a low level of cash flow volatility as monthly sales and purchases typically align in both pricing and volume.
The group uses derivative instruments, forwards and swaps, to reduce these profit and loss exposures. The group applies a policy of hedging 50% of its US Dollar aluminium price lag risk exposure and 50% of its currency risk exposure on the metal lag. Eliminating 100% of the price risk with derivatives would create a cash flow risk if the spot prices were to rise strongly since new inventory would have to be purchased at a higher price than the proceeds received net of derivative settlements.
The unhedged fluctuation in the US Dollar aluminium price from the date of purchase of aluminium to the date of sale results in a metal price lag impact on profits. During the current financial year the group made a pre-tax gain of R4 million from metal price lag (2017: R150 million gain). This net gain was made up of Dollar-denominated gains on the purchase and subsequent sale of metal offset by losses on derivative instruments.
Foreign-denominated receivables, payables and import transactions (currency risk)
The group hedges its currency exposures on foreign-denominated receivables and payables from invoice date to expected receipt or payment date and on import transactions from the date of commitment.
INTEREST RATE RISK
The group is exposed to interest rate risk with respect to its borrowings which carry variable rates. Net interest payments of R80 million were 19% lower than that incurred in the prior year (including interest capitalised of R7 million).
MATERIAL ITEMS
IMPAIRMENT ASSESSMENT OF ROLLED PRODUCTS ASSETS
International Accounting Standard (IAS) 36 requires that management assess the carrying value of assets at every reporting date for possible impairment in value where an indicator of impairment exists. Where the share price of a listed entity trades at a discount to its underlying net asset value such an indicator is triggered and management are obliged to determine the value in use of the assets and should this be below their carrying value, make an appropriate adjustment.
Hulamin is focused on improving returns to shareholders. We are actively managing this through delivering EBITDA performance, tighter control over capital expenditure, paying down debt levels and now additionally through imposing a higher hurdle rate for improvement projects.
Mounting uncertainty in the macro environment and the associated rise of risk indicators, has also supported increasing the company’s weighted average cost of capital (WACC) to more accurately value the company’s internal forecasts of future cash flows.
This WACC increase results in material changes to the valuation of assets and, as a consequence, an impairment charge of R1.376 billion has been applied to Hulamin Rolled Products and R74 million to Hulamin Extrusions.
Full details are provided in note 5.3 to the financial statements and the determination was reviewed by the company’s external auditors. Key sensitivities are explained in the note and the Rand/US Dollar exchange rate assumed is a key determinate of the value in use of the assets due to the impact of the exchange rate on profitability. The valuation assumed a rise in the average Rand/US Dollar exchange rate from R14.27 in 2019 to R15.06 in 2023.
ACCOUNTING POLICIES
NEW ACCOUNTING STANDARDS
The group’s accounting policies are governed by International Financial Reporting Standards (IFRS). Guidance has been obtained from the International Financial Reporting Interpretations Committee (IFRIC) and circulars. The group maintains the view that the standards set the minimum requirements for financial reporting.
During the year, the group adopted the IFRS 9 “Financial Instruments” and IFRS 15 “Revenue from contracts with customers”. The adoption of these standards has impacted the financial statements, which effects have been set out in note 9.8. The adoption of amendments to other standards has not had a material impact on the group.
The group has assessed the impact of IFRS 16 “Leases”, which will come into effect for the year ending 31 December 2018. The impact of this standard has been further described in note 1.2 to the financial statements.
RESTATEMENT OF PRIOR YEAR FINANCIAL INFORMATION
The financial performance of Hulamin Rolled Products is exposed to the impact of metal price lag and accordingly implements a hedging programme to balance the cash flow and profit effects of this lag.
In order to apply hedge accounting as envisaged in IAS 39, the group has historically designated the sale, and not the purchase of the inventory, as the hedged item. This designation causes a mismatch between changes in fair value of the hedged item (which includes rolling margins, geographic premiums and transport costs) and the hedge instrument (which only relates to the commodity portion of the sale).
We have reviewed the application of hedge accounting in terms of the IAS 39 standard and believe that the expectation of prospective hedge effectiveness as envisaged in the accounting standard is not appropriately satisfied and could therefore create volatility which would be expected to breach the effectiveness guidelines provided in IAS 39. The comparative results have consequently been restated.
There is no cumulative impact on earnings and also no impact on cash resulting from this restatement. Hulamin’s commodity risk management programme is highly effective. Hulamin plans to adopt the new financial instruments standard IFRS 9, in 2019, which will overcome the limitations of IAS 39.
The comparative results have consequently been restated. The impact of this is set out in note 9.7 of the financial statements.
Supplementary information: Free cash flow (adjusted)
Basis of preparation
The cash flow generated from operations and cash flow from investing activities which equates to cash flows before financing activities of Hulamin (“free cash flow”) adjusted for the impact of the inclusion of a significant customer payment (“free cash flow (adjusted)”) included in the report of free cash flow (adjusted) for the year ended 31 December 2018 has been prepared for illustrative purposes only and because of its nature may not fairly present Hulamin’s cash flows.
The free cash flow (adjusted) is based on cash flows before financing activities for the year ended 31 December 2018.
The free cash flow (adjusted) has been prepared to illustrate the free cash flow adjusted for the impact of a significant customer payment that was due to the group and was fully authorised by the customer and scheduled to be paid on that same date. However, the customer’s intra-day bank limit caused the entire payment batch to be blocked and therefore this payment only concluded in early January 2019. The directors of Hulamin feel that this anomaly mis-represents the group’s cash flows for the 2018 financial year.
The free cash flow (adjusted) is presented in accordance with the JSE Listings Requirements. The free cash flow (adjusted) has not been prepared using the accounting policies of Hulamin and does not comply with IFRS.
The directors of Hulamin are responsible for the free cash flow (adjusted) included in the report of free cash flow (adjusted) for the year ended 31 December 2018.
Ernst & Young Inc.’s independent reporting accountants’ report on the report of free cash flow (adjusted) for the year ended 31 December 2018 is available for inspection at Hulamin’s registered office.
| 2018 R million |
2017 R million |
|
|---|---|---|
| Cash flows before financing activities (a) | 90 | 296 |
| In transit cash (b) | 208 | – |
| Free cash flows (adjusted) (c) | 298 | 296 |
(a) Row (a) presents the cash flows before financing activities extracted from the audited financial statements for the year ended 31 December 2018.
(b) Row (b) represents the financial impact of the late payment from the customer on the cash flows before financing activities.
(c) Row (c) represents the free cash flow (adjusted) as at 31 December 2018.
GOING CONCERN
The Board has formally considered the going concern assertion for the group and is of the opinion that it is appropriate for the forthcoming year.
CONCLUSION
Hulamin has again recorded an improved underlying financial performance, building on its improving record of the last few years, supported by a record production and sales performance, together with the impact of improved conversion margins, a focused cost optimisation programme, and prudent management of capital expenditure. This has resulted in the generation of R90 million free cash flow in 2018 (and a cumulative R800 million of free cash flow over the past three years). Free cash flow (adjusted) of R298 million and cumulative R1 billion of free cash flow adjusted over the past three years1.
This permitted a further decrease in Hulamin’s net borrowings, as well as the declaration of an increased dividend and the announcement of a share repurchase programme.

