
-
OVERVIEW
-
THE BUSINESS
-
RELIANCE ON KEY CAPITALS
-
GOVERNANCE AND LEADERSHIP
-
FINANCIAL STATEMENTS
Natural capital
 Hulamin is committed to responsible environmental stewardship of its resources and to ensuring that all its activities result in minimal harm to the environment. Addressing environmental sustainability has thus far been integrated into the way Hulamin runs its business. Structural changes to the business were put in place to enable and sustain monitoring and reporting environmental sustainability alongside developing plans for continuous improvement, including the assessment of environmental risk.
 |
MATERIAL DEVELOPMENTS
LOOKING BACK AT OUR GOALS FOR 2016THE FOCUS FOR 2017 |
NATURAL RESOURCES WE ARE RELIANT ON
Aluminium smelters are heavily reliant on electricity, a scarce and carbon-intensive resource, to produce primary aluminium. The mid- and downstream aluminium industries are reliant on this primary aluminium. This high usage of electricity by the smelters is therefore an indirect capital on which Hulamin is reliant. Hulamin also consumes electricity in its remelt, casting, rolling and extrusion activities.
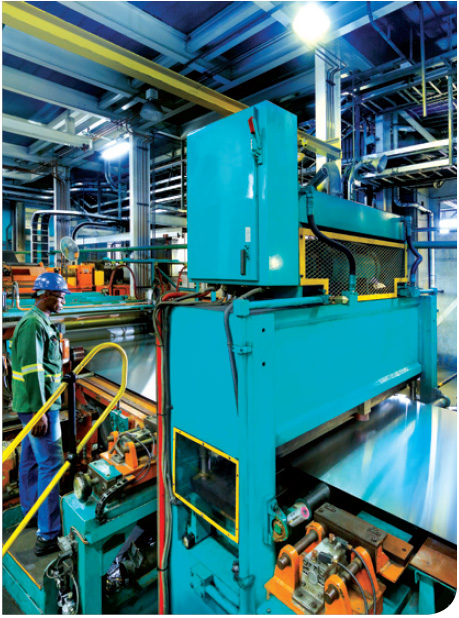
Gas, water and electricity are essential resources used in our production.
ABILITY TO REDUCE RELIANCE ON KEY NATURAL RESOURCES
Aluminium is infinitely recyclable. By recycling aluminium, the initial energy intensive process is eliminated. There is an increasing availability of aluminium scrap, including used beverage cans, in the local market. Recycling scrap creates prospects of improved economic returns for the mid- and downstream industry; and the collection and recycling industry creates additional employment. At the same time we are continuously striving to reduce energy consumption through improved efficiencies and waste management.
OUR COMMITMENT TO REDUCED RESOURCE CONSUMPTION
Every employee at Hulamin is tasked to help sustain our environment. This relates to minimising energy and water consumption and reducing waste to a minimum. To achieve this, we strive to operate as efficiently as possible. Environmental sustainability is driven by our Safety, Health and Environment Committee. Since we pledge to minimise our impact on the environment, we strictly monitor all waste leaving the plant, both effluent waters from our processes as well as solid waste streams. We have contracts with specialist third parties who assist us to manage these waste streams. We also have regular third party testing of our air emissions. We monitor legislative developments; the latest Waste Act has been reviewed by Hulamin to ensure that we comply with all new requirements.
Our impact on Natural Capital in 2016
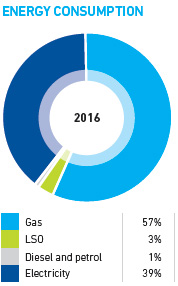
At the end of 2012, Hulamin set intensity targets for all key environmental parameters (consumption per unit ton produced). Despite excellent progress, we did not achieve our target for energy during 2016 due to increasing requirements from the new recycling furnace (new user). Production increased by 17% over 2015 while energy consumption increased by only 8%. Electricity has been well managed while overall fuel gas consumption was higher than expected with renewed commitment to support all possible options to reduce consumption in 2017.
CARBON FOOTPRINT
Hulamin continues to track and monitor Greenhouse Gas (GHG) emissions. We have once again conducted our annual carbon footprint analysis in accordance with the Greenhouse Gas Protocol.
ENERGY
Hulamin has made good progress to improve energy efficiency over the last few years. With improved measurement systems in place, Hulamin is now in a good position to formally implement an energy management system.
| INTENSITY AGAINST 1 ton OF PRODUCTION | ||||
| Carbon footprint (tons CO2e) |
Electricity con- sumption (KWh) |
LPG con- sumption (GJ) |
Water con- sumption (kℓ) |
|
| 2014 | 1,89 | 1332 | 7,48 | 3,02 |
| 2015 | 1,92 | 1393 | 7,52 | 3,32 |
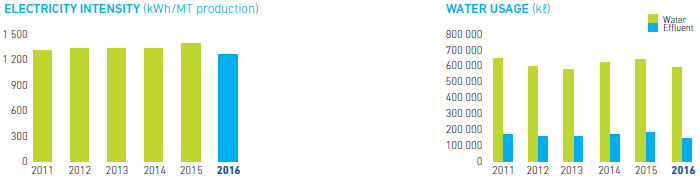
| 2016 | 1267 | 6,99 | 2,66 | |
|
GASAll three of the Camps Drift hot mill pusher furnaces were converted from Liquid Petroleum Gas (LPG) to Compressed Natural Gas (CNG) by September of 2016, after the “proof of concept” pilot installation on Pusher Furnace 3 was accomplished in February. This has reduced Hulamin’s dependence on LPG by about 12%, while also having a positive effect on GHG emissions. Looking ahead to the first quarter of 2017, the conversion of all four of the twin roll casting furnaces, the recycling furnace and both coating lines to CNG is being aggressively pursued and is on track. This will mean that 46% of Hulamin’s gas needs will be supplied from CNG. At the Camps Drift remelt operation, improvement in measurement accuracies of the air and gas flows on our melters and the transfer of liquid metal from the recycling furnace, has led to a 7% improvement in the fuel gas consumption indices. Improvements at the coil coating line were made through the intelligent use of the regenerative thermal oxidiser by automatically switching it to standby mode during certain conditions. |
ELECTRICITY
Accurate data capturing is crucial for understanding and influencing consumption. Due to the complex nature of the Hulamin plant, this is not a simple task. Much of the 2016 effort went into expanding our measurement accuracy as well as the reporting and analysis of our consumption. Our internal metering points have been expanded from 41 to 72 with a target of 150 planned to be achieved within the first six months of 2017. We can now compare our daily consumption on the major machine centres against a modelled consumption and investigate any deviations. Improvements in the accuracy and reliability of this system will continue in 2017.
Energy saving projects in 2016 focused on the installation of variable speed drives on machines with the highest savings potential. Eight projects are active with savings between 35% and 81% of baseline consumption being achieved. A total annualised saving of 3,5 GWh was implemented during 2016. A further 5,5 GWh annualised savings is planned for 2017, which includes the commissioning and optimisation of compressed air control systems.
WATER
South Africa is a water scarce country and we recognise that our duty is to reduce and reuse this scarce recource in an efficient and sustainable manner. In recognising shortcomings in the area of water conservation as Hulamin, a water management team has been set up to identify and manage water concerns. The mandate of this team is to identify water risks, monitor and understand monthly consumption data and to develop action plans for risks and opportunities.
Similar to electricity management, much of the effort during 2016 went into establishing more accurate measurement at the points of consumption. The process involved the installation of more than 50 water meters across the two Pietermaritzburg sites, with the aim of having live reporting on all consumption points and reducing the un-metered consumption portion from 33% down to less than 10%. Commissioning of these meters is in progress.
Water savings opportunities were identified through a water assessment that was conducted on site through the RECP programme of the NCPC. The survey highlighted possible savings of 25% through various re-use and recycling possibilities, as well as water treatment plant improvements. Detailed investigations and pilot projects are in progress to verify these savings.
The water consumption per unit of production in 2016 dropped to the lowest level since 2010. Significant decreases were achieved in the second half of the year so we expect continued and sustainable savings going into 2017, particularly with the implementation
of the identified projects.
WASTE
The drive towards minimising our waste to land fill continues. Hulamin waste levels in 2016 decreased by approximately 16% from the previous year; this is despite significantly increased production in 2016. This is an area of our business that will continue to receive increasing attention going forward.
 |
 |
| DISPOSED WASTE VOLUMES (tons) | ||||
| 2013 | 2014 | 2015 | 2016 | |
| General | 744LA | 764LA | 540LA | 458LA |
| Low hazardous | 5 039LA | 5 150LA | 6 161LA | 5 135LA |
| High hazardous | 2,0LA | 4,4LA | 2,6LA | 0LA |
| Recycled | 763LA | 1 031LA | 1 226LA | 1 391LA |
| Total landfilled | 5 785 | 5 918 | 6 703 | 5 593 |
